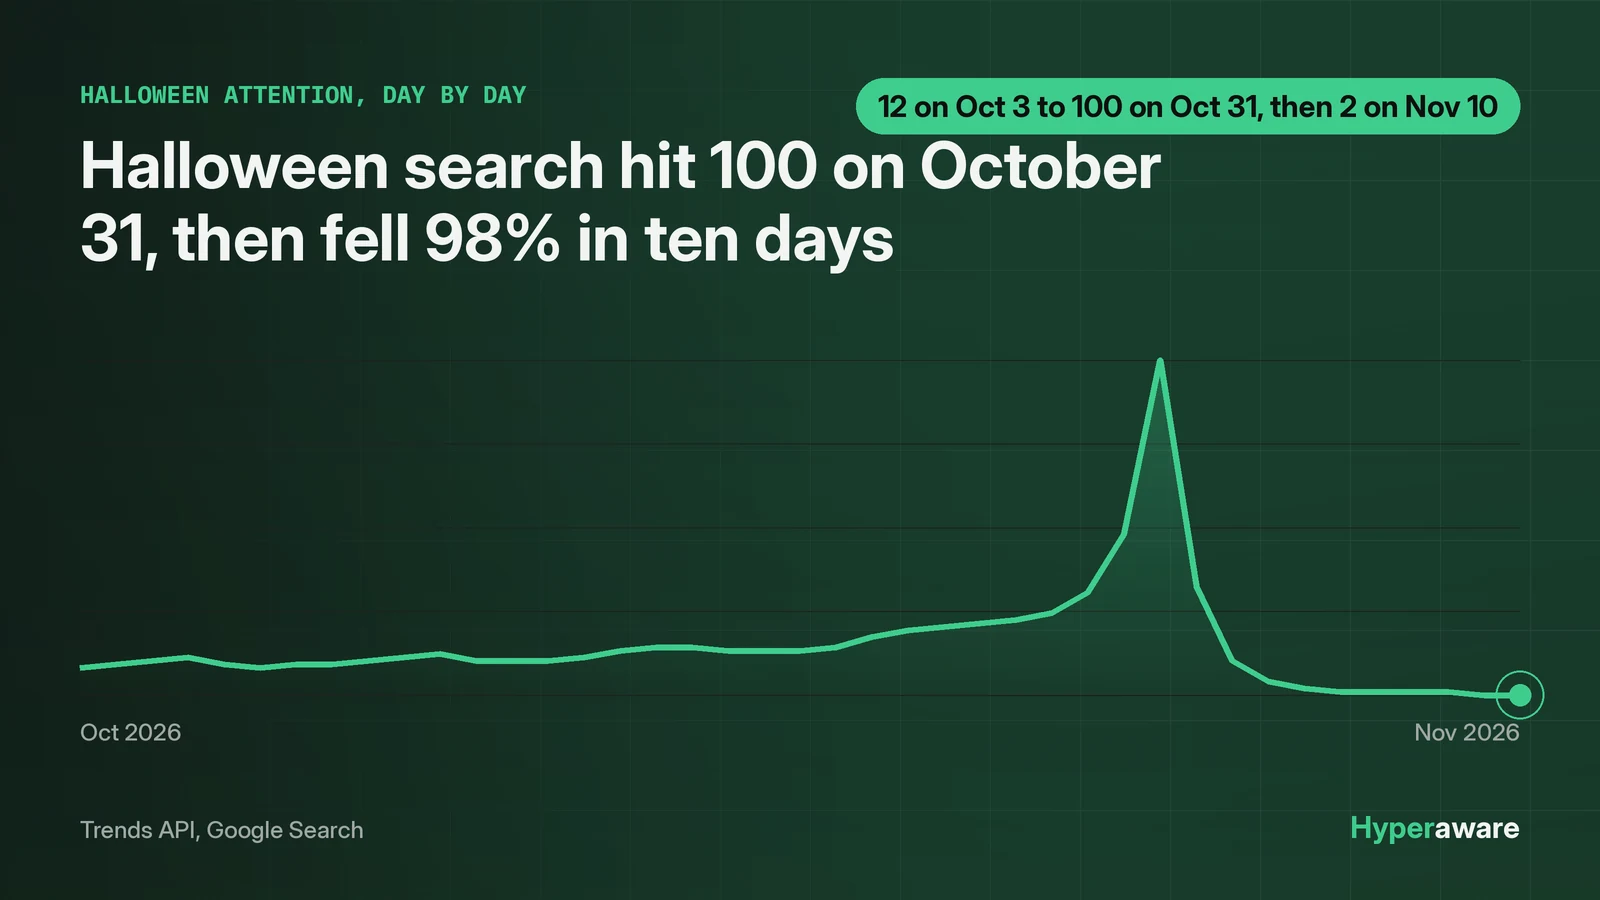
Halloween search in 2026 peaked on October 31 and then collapsed. On October 3, Google Search interest in "halloween" stood at 12. It hit 100 on October 31 and fell to 2 by November 10, a 98% drop in ten days. The four terms in this study did not move together. "pumpkin" crossed 25 on September 19 and spent 11 days above 50 in total, "halloween costume" jumped to 32 for a single day on August 25 and then held above 25 from October 3 through November 2, "trick or treat" crossed 25 only on October 30, and "halloween" itself crossed 25 on October 28. YouTube ran ahead on the ramp and peaked the same day. The 2026 peak ran about 7% above the same point in 2025 for "halloween", so the story of this Halloween is timing, not size.
The peak lasted a single day
"halloween" spent exactly one day above 50 on Google Search. The month opened at 10, reached 13 by the 10th, 16 by the 17th and 21 by the 24th. It crossed 25 on October 28, reached 32 the next day, 49 the day after, then 100 on October 31. The next day it was 34. By November 2 it was 12, the same level as October 3, and by November 10 it was 2.
That shape is the whole finding. Halloween attention is not a season that builds and fades. It is a slow climb, from 10 on October 1 to 21 on October 24, that bends up sharply in the last four days and then snaps back. From October 3 to October 31 the index rose 733%, from 12 to 100, and almost all of that rise came after October 28. From October 28 to October 31 the index rose from 26 to 100, a jump of 74 points, after climbing only 14 points between October 3 and October 28.
The October recap on this site recorded the month in broad strokes. This report adds the daily curve the recap did not have: the peak day, the four-day ramp, and the ten-day collapse after it. The same velocity lens runs through the November breakout report, which tracks the month's fastest-rising stories.
Costumes jumped for a day in August, trick or treating crossed 25 on October 30
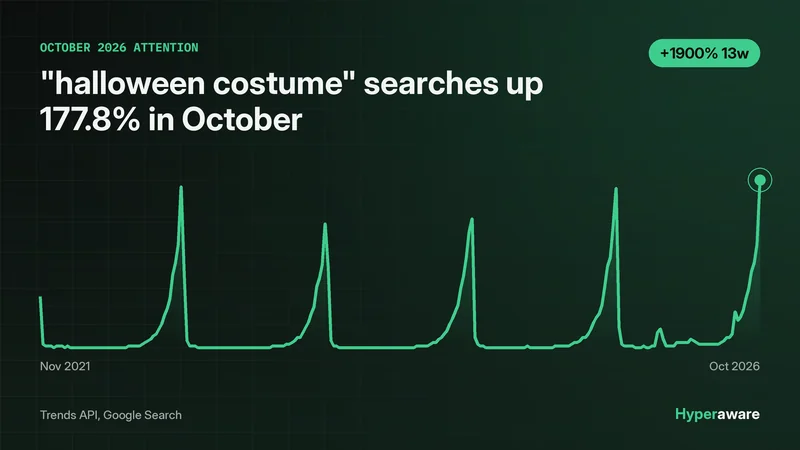
The four terms in this study ramped on four different clocks. "halloween costume" jumped to 32 for a single day on August 25, fell back to 12 the next day, and then held above 25 from October 3 through November 2. It crossed 50 on October 26 and spent six days above 50, against one day for "halloween" itself. Its October 3 value was 28, so the rise to 100 on October 31 was 257%, a gentler slope than the head term because costume searching had already been running since early October.
"trick or treat" is the opposite shape. It sat at 3 on October 3 and only 10 by October 24. It crossed 25 only on October 30, at 32, and hit 100 the next day. From October 3 to October 31 it rose 3,233%, from 3 to 100, the steepest climb in the set, and it fell the fastest too: 20 on November 1, 5 on November 2, 1 by November 10, a 99% drop from the peak.
"pumpkin" ramped earliest of all. It crossed 25 on September 19 and 50 on October 10, three weeks before the holiday. It spent 11 days above 50 in total, more than any other term in the set, though the days were not contiguous: the longest unbroken run above 50 was four days. Its October 3 value of 44 meant the rise to 100 was only 127%, the shallowest of the four.
Read together, the four curves suggest three different jobs. Pumpkin is the long seasonal job, starting in September. Costumes are the planning job, starting in August and building through October. "halloween" and "trick or treat" are the event itself, low until the final week and then vertical.
Pumpkin stayed high longest, then faded slowest
Pumpkin is the only term in the set that did not return to near zero. It hit 100 on October 31, fell to 44 on November 1, 23 on November 2 and 13 by November 10, an 87% drop from the peak. That is still a collapse, but it left a floor the other terms did not have. "halloween" fell 98% over the same ten days, to 2. "halloween costume" also fell 98%, to 2. "trick or treat" fell 99%, to 1.
The likeliest reading is a calendar one. Pumpkin is a food and a decoration, and both uses outlast the night of October 31, while the other three terms describe the night itself. The data shows what moved, not why, but the split fits: once the night passed, the search reason for the other terms passed with it, while pumpkin kept a reason to be searched for another ten days, at 13 on November 10, or 13% of its peak.
Pumpkin was also the most volatile of the four before the peak. It opened the second week of October at 59, dropped to 46 two days later and 36 the next day, recovered to 66 by October 17, slipped to 39 three days after that, climbed to 84 on October 25, dipped to 50 on October 28 and rose to 100 on the 31st. The dips have no explanation in the search data itself, and this report does not offer one. The broader point stands: pumpkin was the only term that looked like a season rather than a spike.
YouTube ran ahead on the ramp, then peaked the same day
Search on YouTube drew the same curve but ran ahead of Google Search in the final climb. YouTube interest in "halloween" stayed between 15 and 27 through October 24. It crossed 25 on October 24, four days before Google Search crossed the same line, and it ran higher relative to its own peak through the final climb: 39 on October 29 against 32 on Google Search, and 61 on October 30 against 49. Both peaked at 100 on October 31. Each series is indexed to its own peak of 100, so the comparison is of relative position, not absolute volume.
The YouTube rise from October 3 to October 31 was 456%, from 18 to 100, steeper than Google Search for "pumpkin" but gentler than Google Search for the head term. YouTube spent two days above 50, against one day on Google Search. YouTube fell more slowly after the peak: 48 on November 1 against 34 on Google Search, 23 against 12 on November 2, and 7 against 2 by November 10, a 93% fall against 98%.
Two platforms, one date. The peak landed on October 31 on both, which points to the calendar rather than a platform event, though the data alone cannot prove the cause. The October recap recorded a Halloween songs compilation leading YouTube's 30-day trending board, and the daily series adds that the platform's Halloween attention, like search, was a one-day event with a four-day ramp, and that YouTube got there first.
2026 was barely bigger than 2025
The Trends API growth call puts the 2026 peak for "halloween" 7% above the same point in 2025, measured against November 1, 2025. On the growth call's own aggregation the recent value was 76 against a baseline of 71, which is where the 7% comes from; the daily series in this report reads 100 at the peak because it normalizes to its own window. For "pumpkin" the growth call reads 95 against a baseline of 100, or 5% below the same point in 2025. Halloween 2026 was not a record year for attention. It was an ordinary year with an ordinary peak, arriving on October 31.
That matters because the daily curves look dramatic. A 733% rise and a 98% fall sound like a surge, but both numbers describe movement inside a single seasonal window, not growth over the year. The demand underneath is large and stable. Keyword Planner puts monthly volume at 4,090,000 for "halloween", 2,240,000 for "halloween costume" and 201,000 for "trick or treat". The exact phrase "halloween 2026 search data" returns no volume at all, which is normal for a phrase nobody types.
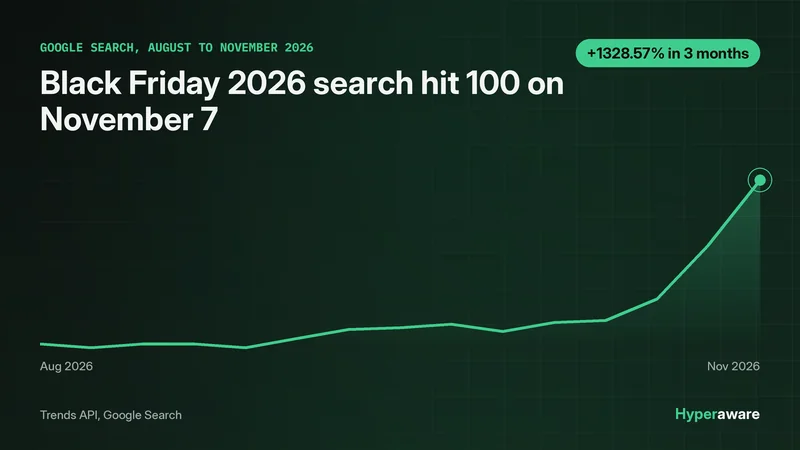
The comparison worth making is with the next seasonal spike. The Black Friday attention report on this site showed a shopping peak that also accelerated late, but its build stretched over weeks. Halloween compressed its rise into four days. The two holidays compress attention on different clocks, and the daily series is what shows which clock each one runs on.
The news cycle moved on to one costume story
Six days after the peak, the Halloween story still in the news cycle was a costume. The Trends API news index carried a story about Martha Stewart's apology for a Halloween costume described as portraying a homeless person, covered by five outlets in five articles, ABC News, NBC News, NBC4 Washington, TODAY.com and the New York Times, with the index item dated November 6. Stewart posted the apology to Instagram on November 1, after an earlier statement that day, according to ABC Audio's November 2 report, and addressed it again on NBC's TODAY on November 6, as The Spun reported that day.
Eight of the ten Halloween items in the news index that week were crime reports tied to Halloween night, which this report does not cover. The Stewart story was the one item about the holiday itself.
That is a thin tail for a spike this large, and it fits the data. Halloween attention in 2026 looks driven by the date, not by a news event. Nothing in the search curves points to a story that pushed the peak earlier or later. The peak landed on October 31, the date of the event itself, which is consistent with a calendar-driven spike rather than a news-driven one, though the data alone cannot prove the cause.
How the numbers were pulled
Every series in this report comes from the Trends API, pulled on November 11, 2026. Four terms were tracked on Google Search at daily resolution from August 11 to November 10, 92 days, plus "halloween" on YouTube over the same window. Values are a 0 to 100 index, normalized per term, so each term's peak day reads 100. Values are comparable across dates for one term, not across terms in absolute volume. Keyword Planner supplied the monthly volumes. The news items come from the Trends API news index for the week to November 11.
Readers comparing this report with the October recap will see different numbers for the same terms, and the reason is the window. The recap, with data as of November 2, used the API growth call over a month window, which put "halloween costume" at 36 on October 3 and 100 on October 31, a rise of 177.8%, and "pumpkin" at 48 on October 3 and 95 on October 31, a rise of 97.9%. This report pulls daily series over August 11 to November 10, which re-normalizes each term to its own peak inside that longer window, giving 28 to 100 for costumes, a rise of 257%, and 44 to 100 for pumpkin, a rise of 127%. Same underlying data, different window and normalization. The daily figures in this report are the ones to use for the ramp and the collapse; the recap figures describe the month as a whole.
Two quirks in the raw series deserve a note. "halloween costume" jumped to 32 on August 25, then fell back to 12 the next day, a one-day spike with no explanation in the data. "pumpkin" dipped from 84 on October 25 to 50 on October 28 before recovering. Both are reported as observed, not explained.
The limits are plain. Search interest is attention, not attendance, spending or sentiment. The data says what moved and when, not why people searched or whether they enjoyed what they found. The year-over-year figures come from the API's growth call, which uses a different aggregation than the daily series, so the 7% and 5% figures are the API's own reads, not numbers computed from the daily points in this report. Halloween 2027 will have its own curve, and the first check is whether the ramp still starts in the last four days.